I’ve had a server running at home for a while to run various things for work and personal use and recently I put Home Assistant on it to have a play with. If you haven’t heard of Home Assistant before it is an Open source home automation that puts local control and privacy first.
One thing that I wanted to do was be able to monitor the server status itself, things like storage, memory usage and temps then feed that into Home Assistant so I could try out a notification pipeline. The problem was since my HA instance runs as a docker container it doesn’t have direct access to those APIs in windows to give out that kind of info.
To get around this limitation I figured I had a look at a few tools that could surface that info as a Rest API that HA could consume but none did quite what I wanted easily so I decided to write my own light weight api to surface this data (also because it was fun). Then using the built in rest integration within HA I could set it up to read this data in as sensors.
I did this in .net core using the System.IO.DriveInfo.GetDrives() method which gets me all the details I need about the attached hard drives. Once I had that I filtered out to only should fixed drives (ie. non-removable storage) and mapped it to a model object so that I could output it as JSON without circular reference issues. I also outputted it as a dictionary where the drive letter was the key, this is to make it easier to pick up the specific drives later in HA.
Here is the code for the controller:
using Microsoft.AspNetCore.Mvc;
using System.IO;
using System.Linq;
namespace WinSysMon.Controllers
{
public class HomeController : Controller
{
[Route("drives")]
public IActionResult Drives()
{
DriveInfo[] drives = DriveInfo.GetDrives();
var driveModels = drives
.Where(d => d.DriveType == DriveType.Fixed)
.Select(d => DriveInfoModel.Create(d))
.ToDictionary(d => d.Name.Split(":").First());
return Json(driveModels);
}
}
public class DriveInfoModel
{
public long AvailableFreeSpace { get; set; }
public string DriveFormat { get; set; }
public string Name { get; set; }
public long TotalFreeSpace { get; set; }
public long TotalSize { get; set; }
public string VolumeLabel { get; set; }
public static DriveInfoModel Create(DriveInfo drive)
{
return new DriveInfoModel
{
AvailableFreeSpace = drive.AvailableFreeSpace,
DriveFormat = drive.DriveFormat,
Name = drive.Name,
TotalFreeSpace = drive.TotalFreeSpace,
TotalSize = drive.TotalSize,
VolumeLabel = drive.VolumeLabel
};
}
}
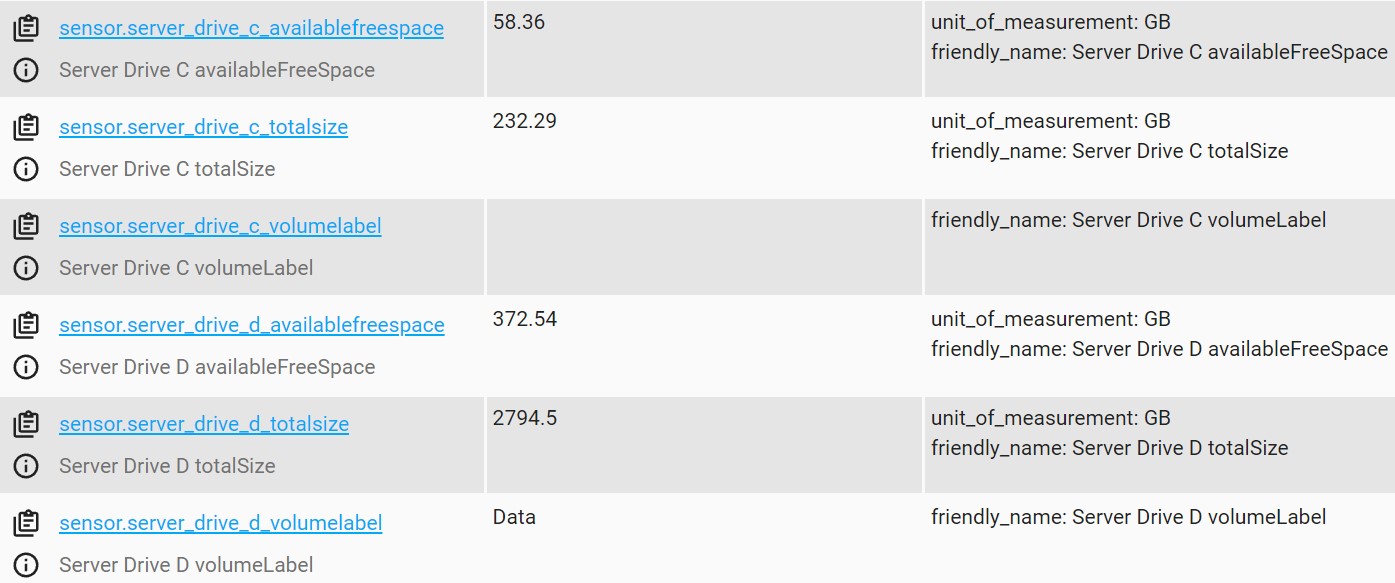
}Once that was done and the API was working I needed to setup the sensors in HA using the rest integration. I setup 3 sensors per drive: availableFreeSpace, totalSize and volumeLabel which gave me enough info to do what I needed. The rest integration can be configured via the yaml file in HA and it allows you to setup multiple sensors from a single endpoint it also lets you set the interval times and authentication.
Using host.docker.internal as the url so that my HA instance running in docker can reference the host PC. Also doing some calculations on the values here since the API outputs the values in bytes so that I can just read them in as GB with 2 decimal places which is enough for me but can be changed easily.
Here is my yaml configuration for the rest sensors setting
rest:
  - scan_interval: 600
    resource: http://host.docker.internal:55555/drives
    sensor:
      - name: "Server Drive C availableFreeSpace"
        value_template: "{{(value_json.C.availableFreeSpace | float / 1024 / 1024 / 1024) | round(2)}}"
        unit_of_measurement: GB

      - name: "Server Drive C totalSize"
        value_template: "{{(value_json.C.totalSize | float / 1024 / 1024 / 1024) | round(2)}}"
        unit_of_measurement: GB

      - name: "Server Drive C volumeLabel"
        value_template: "{{value_json.C.volumeLabel}}"


      - name: "Server Drive D availableFreeSpace"
        value_template: "{{(value_json.D.availableFreeSpace | float / 1024 / 1024 / 1024) | round(2)}}"
        unit_of_measurement: GB

      - name: "Server Drive D totalSize"
        value_template: "{{(value_json.D.totalSize | float / 1024 / 1024 / 1024) | round(2)}}"
        unit_of_measurement: GB

      - name: "Server Drive D volumeLabel"
        value_template: "{{value_json.D.volumeLabel}}"
This will add some new entities to Home Assistant for us which look something like this in the dev tools.
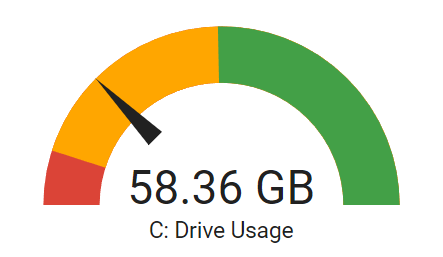
Now that we have the sensor data in HA we can start using it, for now I have put it into a lovelace dashboard but it can also be used in automation rules and setup as triggers etc. I created a simple gauge card to test it setting severity with red as under 10%, orange as under 50% and green over 50%.
|
|
From here next steps would be to look at integrating more sensors into the pipeline such as memory and temperature which can be done by querying with System.Manamgent.ManagementObjectSearcher.